
Data Analytics
Retail Sales and Inventory Analytics
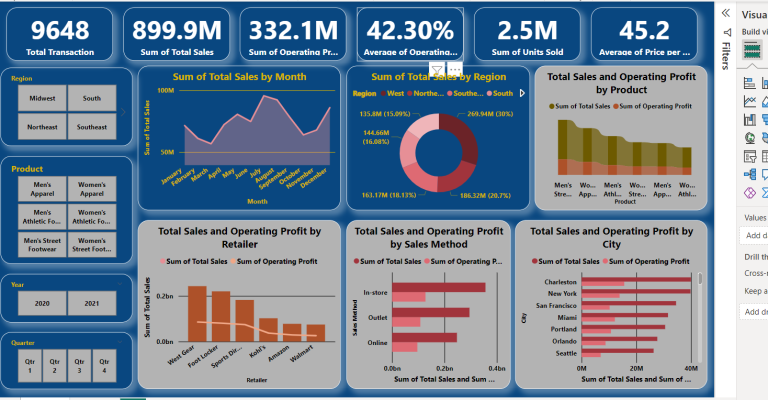
An interactive Power BI solution that brings sales, margins and inventory into one view, helping retail managers compare branches, track products and prioritize replenishment.
Project Overview
Rivora Retail needed a consistent view of sales and inventory across its branches. The project consolidated transaction, product and stock data into a shared analytical model. An interactive Power BI report enabled management to explore revenue, gross margin, returns and inventory availability by period, branch and product category.
-
The Challenge
Sales and inventory reports were maintained in separate spreadsheets. Product names and category labels were inconsistent, and branch reports used different calculation rules. Managers spent time reconciling figures before they could investigate weak sales, low margins or stock availability.
-
The Approach
Define business questions and agree on KPI definitions with stakeholders. Profile the source data, standardize product and branch identifiers, and reconcile sales totals. Build a star schema and reusable DAX measures. Develop report pages iteratively, validate sample transactions and document the refresh process.
-
The Solution
SQL Server stores the consolidated sales and inventory tables. Power Query applies repeatable cleaning and transformation steps. Power BI provides an executive overview, branch comparison, product performance and inventory monitoring. Filters allow users to explore dates, branches and categories, while drill-through pages provide product-level detail.
Project Achievements
- Unified sales and inventory reporting in one analytical model.
- Standardized revenue, gross margin and return calculations.
- Built interactive views for executives and branch managers.
- Documented data definitions, refresh steps and validation checks.
The Results
- Centralized reporting for sales and inventory.
- Consistent KPI definitions across branch comparisons.
- Clearer visibility into low-margin products and stock availability.
- A repeatable workflow for refreshing and validating reports.
Software and Tools Used
- Power BI
- SQL Server
- Power Query
- DAX